The Chubby Programmer Diet Part II - Feedback
The basis for any informed decision is data. In this post, I will talk about how I take body measurements in a way that helps me stay successful in my attempts to lose weight.
This part of my diet (collecting data) is heavily influenced by The Hacker’s Diet, although the data is used for different purposes (The Hacker’s Diet suggests calorie counting, which I strongly object to).
This is Part II of a series of posts. Other posts in this series:
- Part I - Exercise
- Part II - Feedback (you are here!)
- Part III - Eating
Why Do We Need Feedback?
In this post, I will discuss in length what feedback do we need and how to gather it, but first we need to answer the question of why we need feedback to begin with -
Hunger is supposed to tell us when it’s time to eat, but in the modern world, we rarely rely on this message from our bodies. We eat certain meals on a given schedule, with family and friends. And, while hunger tells us when to eat, there isn’t a corresponding signal that says we’ve had enough. Only when the scale begins to rack up extra pounds and the belt seems to need another notch do we realise the cumulative effect of a little too much food every day.
As long as you aren’t hungry, you’re probably getting enough food, but how do you keep from eating too much? What’s needed, along with food, is feedback—information that tells how you’re doing—when to eat and when to stop.
– John Walker, The Hacker’s Diet: How to lose weight and hair through stress and poor nutrition
The underlying issue is this - our bodies are broken. My body doesn’t tell me when I can stop eating. I don’t need to “stop and listen” to my body whispering me to stop eating. My body seems to constantly yell at me to have more Tiramisu.
The feedback explained in this post will be used for two purposes:
- Increase Motivation: seeing your weight decrease throughout this diet, day after day, gives an extraordinary amount of motivation to keep at it.
- Influence Eating: knowing whether or not you’re on the right track for your weight loss goal can help you decide what and how much to eat. Using feedback to influence your diet will be discussed more in the next post in this series.
What Kind of Feedback Do We Need?
When talking about weight loss and exercise data, there are two measurements that interest me - weight and body fat percentage. The importance of measuring body fat along with weight is that if you’re coupling your weight loss with muscle gains, you need to make sure you’re not “penalizing” yourself for not losing as much weight when in fact you’re gaining muscle. On the other end, you also need to make sure that you’re not losing weight by losing muscle mass.
In fact, body fat percentage would be the only measurement I would take, if I could measure it as accurately as weight. The problem is that there are many ways to measure body fat, with the accurate ones being expensive. So I’m using a cheap way to measure my body fat (with a scale that also uses electrical current) which I assume is inaccurate - but consistent. Then, I am expecting to see a decrease in body weight percentage - without caring so much for specific numbers.
In order to measure our progress, we need to always know our current weight and body fat percentage. However, just stepping on a scale isn’t enough.
How Do We Get This Feedback?
Sampling and Smoothing
How much do you weigh?
This question is surprisingly hard to answer. Most of us have a number we remember as our “current weight”, but it’s almost always a lie. Our weight can change throughout the day, even up to ~2kg.
Not only does your weight change every day, it also changes at different times through a single day [..]. This is because of body fluid fluctuations — you might be retaining water from too much sodium consumption, or you may not have gone to the bathroom yet (gross, but true). All of these things affect your weight.
[..]
The issue with checking the scale DAILY, is that minor fluctuations can freak people out — or discourage them from their weight-loss efforts. Instead, take photos , body measurements, and judge yourself by your fitness endurance and how your clothes are fitting you. To use the scale effectively, you should weigh yourself once a week.
– Jillian Michaels, MYTH: Weighing Yourself Daily Will Help You Stay on Track
The problem with this fact is that it is often used to draw a false conclusion that weighing yourself daily is bad for you.
This is bullshit.
If your weight can change throughout the day by up to 2kg, think about how inaccurate can one-week measurements be! You might gain one kilogram, but think you’ve lost three, or the reverse! The answer is not to measure less, it’s to measure more, but process the measurements in way that cancels out weight fluctuations. This is called data smoothing.
This is best understood visually, so here is my weight graph from today. The blue line represents actual measurements. The red line represent my “weight trend” - which is my “smoothed” weight.
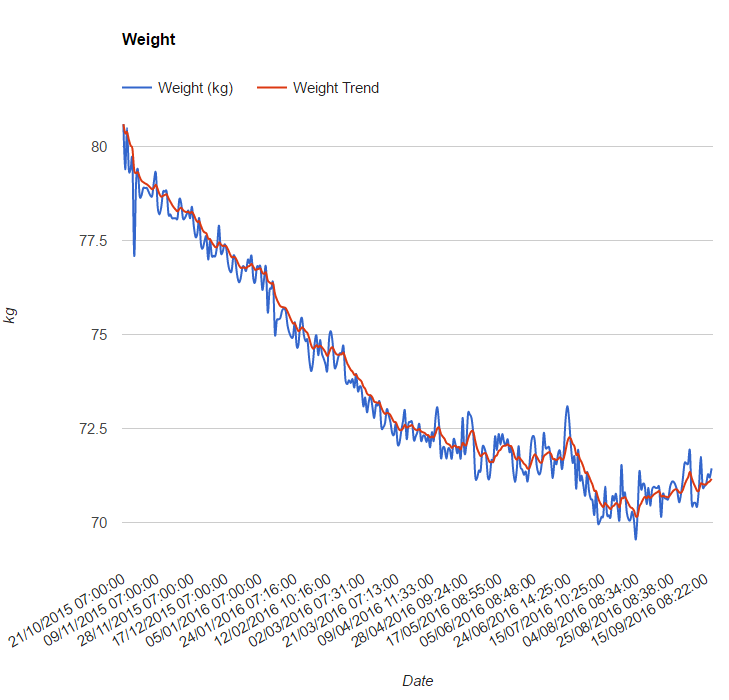
Using data smoothing, we get a graph that changes less rapidly and is less affected by daily fluctuations.
To summarize, we need to:
- Take weight and body fat percentage measurements daily.
- Apply data smoothing to the measurements and use only the results as the “current” and “correct” ones.
Tools
Measure
So we know the theory - measure daily, smooth, repeat. Let’s talk about concrete tools.
At first, I only measured my weight. If you currently don’t have a way to measure body fat, I would recommend that you start weighing yourself daily while in the meantime shopping for a body fat measurement tool.
I tried using online methods for calculating body mass and some cheap electrical body fat device. They don’t work1.
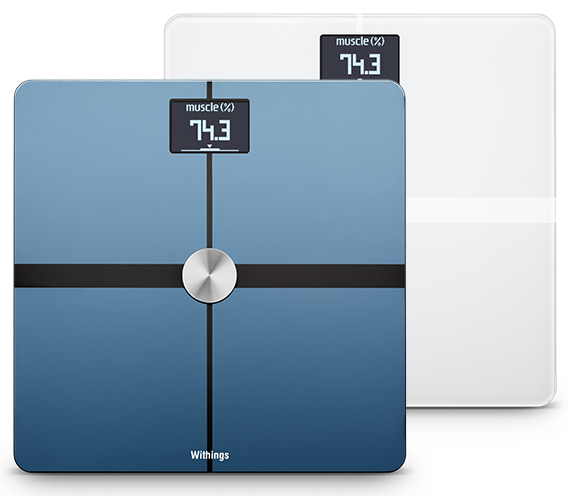
Instead, to measure weight and body fat percentage, I use the Withings Body Scale. Basically, if you want something that’s not fake, you’ll need to pay for it. This Withings scale connects to your home WiFi to submit the result to their app.
Format
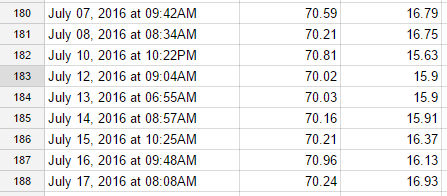
Then, I use this IFTTT applet to automatically take Withings measurements and put them in a Google Spreadsheet. This is how the “raw” data looks like:
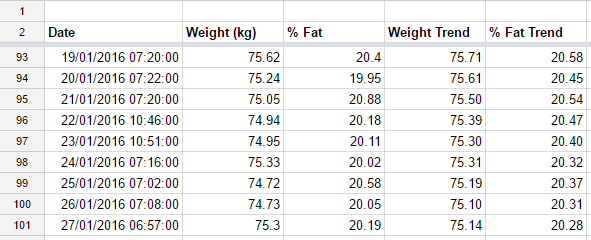
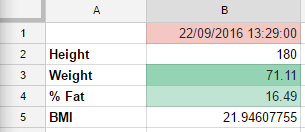
The trouble with this is that the date / time column is not really a format that Excel / Google Sheets can work with, so I need to parse it to a secondary sheet. It’s a mess, but the query looks like this:
=DATEVALUE(DATE(YEAR(LEFT('Raw Withings Data'!A1, SEARCH("at", 'Raw Withings Data'!A1, 1) - 2)), MONTH(LEFT('Raw Withings Data'!A1, SEARCH("at", 'Raw Withings Data'!A1, 1) - 2)), DAY(LEFT('Raw Withings Data'!A1, SEARCH("at", 'Raw Withings Data'!A1, 1) - 2)))) + TIMEVALUE(TIME(HOUR(RIGHT('Raw Withings Data'!A1, LEN('Raw Withings Data'!A1) - SEARCH("at", 'Raw Withings Data'!A1, 1) - 1)), MINUTE(RIGHT('Raw Withings Data'!A1, LEN('Raw Withings Data'!A1) - SEARCH("at", 'Raw Withings Data'!A1, 1) - 1)), SECOND(RIGHT('Raw Withings Data'!A1, LEN('Raw Withings Data'!A1) - SEARCH("at", 'Raw Withings Data'!A1, 1) - 1))))The formatted sheet looks like this:

Process
Next, I put the data in a third sheet which also calculates the trend
To calculate my weight trend, I use an exponentially smoothed weighted moving average with a smoothing factor of \(0.2\). Let \(T_n\) be the trend for day \(n\) and \(M_n\) the measurement for day \(n\):
\[T_n = 0.2M_n + 0.8T_{n-1}\]The upshot of this is that the trend is slower to respond to changes in measurements. This means that a single day anomaly won’t have much effect on the overall trend, but a consistent change will be noticeable in the overall trend.
=IF(ISBLANK($B98), "", ($B98*($J$2) + $D97*(1-$J$2)))J2 is a cell that simply contains the smoothing factor \(0.2\). It’s a good idea to put this constant in a cell where you can easily play with its value and see the results in real time. Using dollar signs in front of the column or row indicates that they are constant and will not change when you drag the formula to other cells.
Next, on the top I get the latest trends from the table:
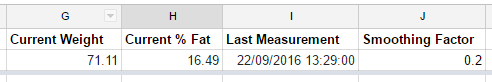
This is achieved by getting the last value in a certain column (e.g., for weight):
=INDEX(D:D,MAX((D:D<>"")*(ROW(D:D))))Visualize
Alright. We’re measuring, formatting and processing. Now what? Well, I’m not really interested in specific measurements and I want to just get an overall “Thumbs Up” / “Thumbs Down” status report. So, in a final sheet2:
The colors are generated with the “Conditional Formatting” feature. The date is green if it is equal to todays date (i.e., “did I take a measurement today”) and the weight / % fat cells are white for a certain threshold (which I will discuss in the next part of this series) - green below (good!) and red above (bad!).
In Practice
While it did take some considerable time to set up, in my day-to-day it takes me about 30 seconds to log my measurements - I just step on to the scales and wait for it to finish. My trends are automatically calculated and I can just take a quick look at my main sheet and if everything is green - I’m good to go.
In the next post, I’ll describe how I use this indication to change my eating behavior - so that I can allow myself to eat Tiramisu while still losing weight.
Follow me on Twitter and Facebook
Thanks to Hannan Aharonov for reading drafts of this.